


It was 11 August 2021 when thermometers at the Floridia monitoring station operated by the Sicilian Agrometeorological Information Service (SIAS) recorded a temperature of 48.8°C, a value that would be officially certified several years later by the World Meteorological Organization (WMO) as the highest temperature ever recorded in Europe.
The record attracted the attention of the European mainstream press, but it may not last long: in 2023, temperatures reached 47.2°C in Noto, 47.1°C in Lentini and more than 47°C in Syracuse, while several long-established weather stations—including Palermo Boccadifalco, with 45.2°C—shattered their local records of the previous twenty years. This is a clear sign that average maximum summer temperatures are continuing to remain systematically above the levels typically recorded in past decades.
A particularly interesting and informative indicator is based on the number of consecutive days with temperatures equal to or above 40°C. In addition to representing the climate anomaly, it effectively describes extreme conditions affecting the health of the most vulnerable members of the population, particularly older people and children. According to data processed at regional level using observations of mean daily temperatures from SIAS-operated stations, this indicator stood at two days in both 2007 and 2021, before doubling two years later, with as many as four consecutive days of temperatures consistently above 40°C in 2023.
Another significant measure is the ETCCDI SU index, also known as Summer Days or Hot Days, which indicates the number of days in a year on which the daily maximum temperature exceeds 30°C or 35°C. It is one of the 27 standardised climate indices established by the WMO to monitor climate change. As regards the SU30 index, the twenty-year average is approximately 63 days with temperatures above 30°C. Since the beginning of the millennium, no significant deviations from the average had been recorded, and fluctuations were distributed almost evenly, with positive or negative differences of around ten days. Put simply, in some years the number of days with temperatures above 30°C was slightly higher than 63, while in others it was slightly lower. Everything changed in 2019, after which the number of days remained consistently above average, whereas previous years had shown fluctuations, reaching a peak of 90 days above 30°C in 2022—almost one-third more than the average.
The SU35 index is even more extreme: the annual average is approximately 13 days with temperatures above 35°C, but since 2021 the figure has remained consistently higher, reaching a peak of 31 days in 2021—more than double the average—and 26 days in 2022. The same trend is confirmed by the ETCCDI TR20 index, known as “Tropical Nights”, which measures the number of nights with temperatures above 20°C: this figure has risen rapidly over the past three to five years.
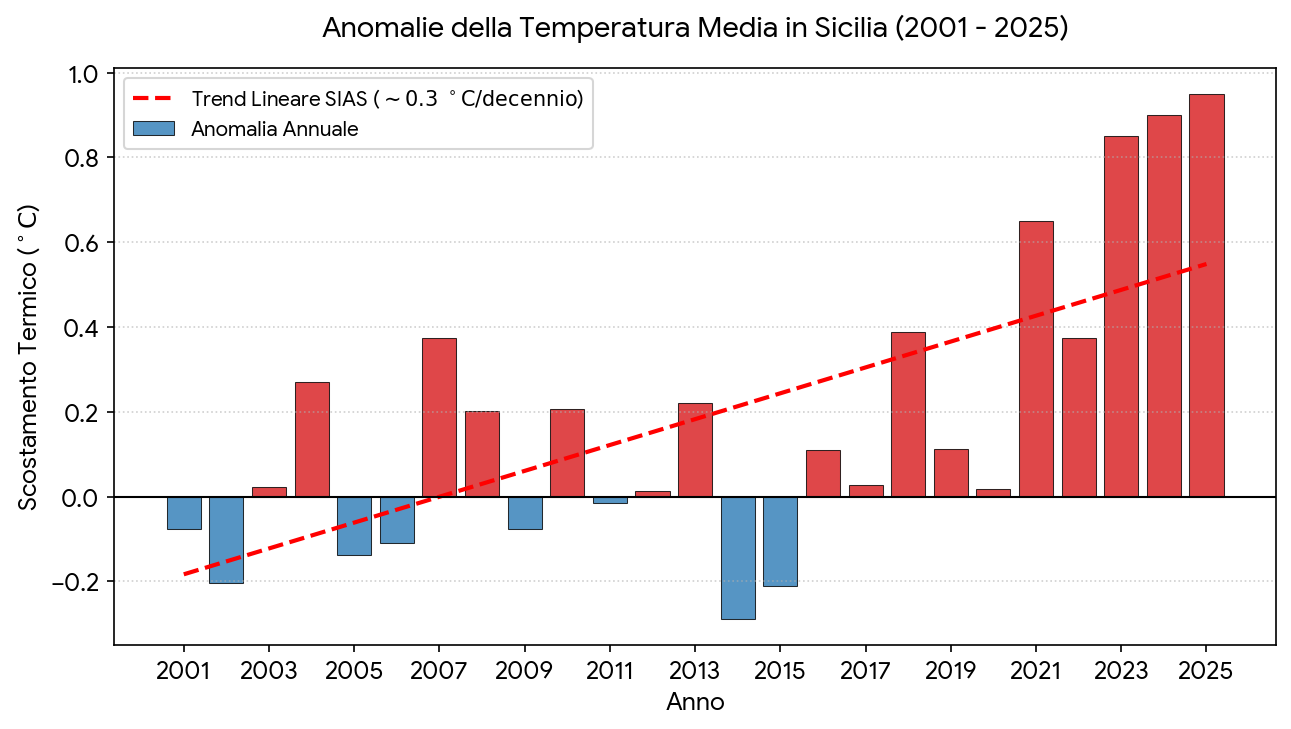
Seasonal temperature time series for Sicily’s nine provinces reveal a clear and persistent warming trend between 1951 and 2024, with anomalies becoming increasingly frequent and intense in every season. Winter anomalies typically range between +1.0°C and +2.5°C, with several warm events exceeding +3°C in Palermo, Messina and Catania, while cold anomalies below −1°C are largely confined to the period before 1970. Spring temperatures show a similar upward shift, with anomalies commonly ranging between +1.5°C and +3°C and peaks above +3.5°C in inland areas such as Enna and Caltanissetta. Summer displays the most intense and consistent warming, with anomalies frequently reaching +3°C to +4°C and occasionally exceeding +5°C in Catania, Agrigento and other inland basins. Autumn anomalies generally range between +1.5°C and +2.5°C, with warm peaks above +3°C particularly evident along the southern and western coasts.
Across all subregions, the anomaly markers show a clear progression over time, with a mixture of warm and cold anomalies before 1980, predominantly warm anomalies between 1980 and 2000, and almost exclusively positive anomalies after 2000, reflecting an acceleration in regional warming.
The data do not lie. A trend is under way that, in numerical terms, describes a climate moving increasingly towards extreme peaks, and doing so in a consistently uniform manner: comparable data recorded across the different elevation zones confirm an extremely rapid rise in temperatures. Over the past decade, markedly positive anomalies have been recorded almost every year, culminating in the extreme peaks of the last five years. By contrast, the average number of rainy days is declining. In 2023, a decidedly anomalous year from both a climatic and meteorological perspective, average total regional precipitation amounted to 588 millimetres, approximately 22% below the 2003–2022 average. Curiously, 2023 saw both the driest October since at least 1921 and the wettest May.
Unlike the temperature data, an analysis of average annual precipitation does not show any significant increase in negative anomalies. Looking at the past decade, rainfall was below average in six years—2016–2017, 2020 and 2022–2024—and not by a substantial margin. By contrast, 2018 and 2021 were respectively the fourth- and fifth-wettest years since 1951, despite the severe drought of 2024. This was not the case in the past: between 1983 and 1995, the island experienced twelve consecutive years of below-average rainfall, with 1989 ranking as the fourth-driest year since 1951. Similarly, between 1998 and 2002, the region went through a five-year period of low rainfall which, although not extreme in absolute terms, contributed to a severe water emergency, particularly in 2002.
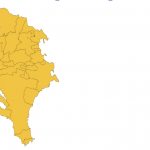
It is worth emphasising that the effects of drought on water-supply systems and end users vary according both to their capacity to adapt—their resilience—and to their geographical location. Extreme weather events may affect different parts of the island unevenly, just as rainfall itself is unevenly distributed: the map below illustrates these differences perfectly.
Therefore, although the 2002 drought was more severe than the 2024 drought in terms of lower average annual rainfall at regional level, the impact of the latter was more serious in terms of geographical extent and the sectors affected (not only agriculture, but also drinking-water supplies, with severe rationing in several municipalities). Identifying trends in the evolution of rainfall is rather complicated, since precipitation has actually increased over the past thirty years compared with the preceding thirty-year periods.
The map below shows the SPI, or Standardized Precipitation Index, over periods of 3, 6, 12, 24 and 48 months. The index expresses the severity of a drought event—understood as a precipitation deficit—over a specific timescale, usually measured in months, on the basis of historical data. Developed by McKee et al. (1993), it is one of the most widely used indicators internationally for drought monitoring.
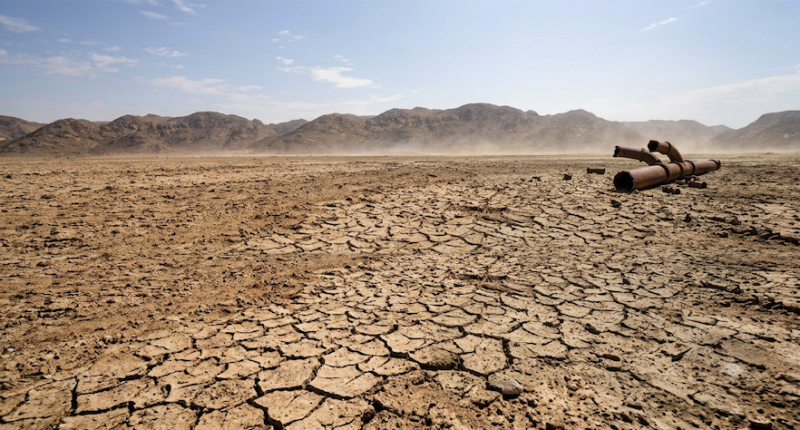
In conclusion, there does not appear to be a direct correlation between meteorological drought—that is, a shortage of rainfall—and a water emergency. Ongoing climate change, with temperatures constantly rising and precipitation increasingly concentrated into fewer days each year, can explain only part of what happened in 2024.
Rising temperatures and climate anomalies, although increasingly extreme and occurring at ever shorter intervals, cannot on their own account for the increasingly frequent water emergencies affecting large parts of the island. The fact that Sicily experienced severe weather and climate conditions in previous decades, albeit not with the almost systematic frequency seen in recent years, neither justifies the current situation nor absolves the political and administrative authorities. On the contrary, it holds them directly accountable, because the available data, their analyses and experts’ warnings made the recurring nature of major droughts in Sicily entirely foreseeable. Those who currently hold, or previously held, decision-making power did nothing—or did too little and, judging by the results, did it badly—to prevent them.